
Your portfolio is red. The headlines are loud. This week the S&P 500 had its worst week since April 2025, with seven straight down days, the longest losing streak since February 2020. The market's fear gauge just hit its highest level in a year and a half.
I get it. It feels bad.
But I've seen this movie before. I lived through the dot-com boom and the dot-com bust. I watched companies everyone called dead turn into trillion-dollar giants. And I think what's happening right now is one of those moments you look back on and wish you'd been braver.
This is my thesis, in eight exhibits.
The thesis: a sell-off in a midterm election year has almost always been a gift. AI is a bigger shift than the internet was. I'm buying the leaders all the way down.
What I've been listening to
For the last few days I've been listening to two very different sources: the guys on the All-In Podcast and Tom Nash. Then I asked AI to test my hunch against 76 years of stock market data. What came back surprised even me.
Three surprises in eight weeks
Markets don't react to news. They react to surprises. In the last few weeks we got three big ones.
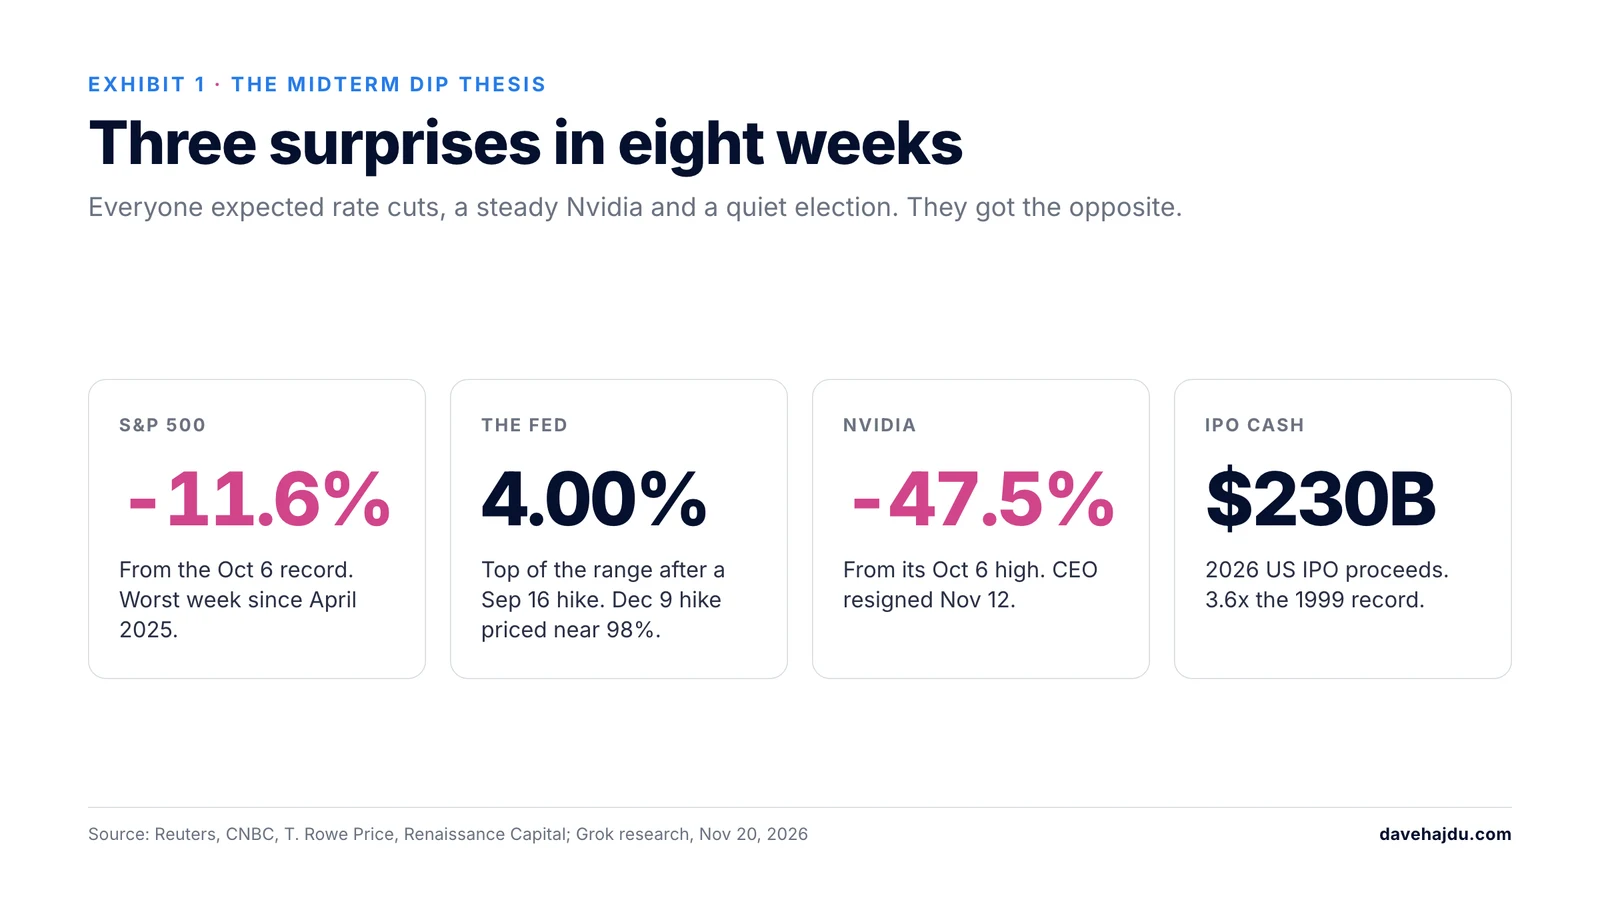
- The Fed went the wrong way. Everyone expected interest rates to come down. Instead, the Fed raised them in September, and the market now sees about a 98% chance of another hike on December 9. Higher rates make borrowing more expensive and stocks less attractive in the short run.
- Nvidia lost its leader. Jensen Huang, the CEO who built Nvidia into the heart of the AI boom, resigned on November 12. There's no permanent replacement yet. The stock is down 48% from its October high.
- Washington changed hands. Democrats won Congress on November 3 and are planning a wave of AI bills: safety testing, liability rules, and making data centers pay more for power. On top of that, new rules on exporting chips overseas took effect this week.
And one more thing: two giant IPOs pulled cash out of the market. SpaceX raised $75 billion in June, and Anthropic raised $81 billion this week. That's about $182 billion of investors' money in five months. Total US IPO money this year hit $230 billion, more than three times 1999.
Put all of that together and you get exactly what we're seeing: a scared market.
I watched giants nearly die
When the dot-com bubble burst, it didn't just take out the silly companies. It took out the great ones too.
Amazon fell 94% and took almost 10 years to get back to its old high. Microsoft fell 65% while it was making tons of money, and it took almost 17 years to recover. People called Amazon a joke. Today it's one of the most valuable companies on earth.
The lesson I learned: a crash doesn't mean the technology was wrong. It means the price got ahead of itself. The internet really did change everything. The stocks crashed anyway. And the people who bought the real winners near the bottom did incredibly well.
Why AI is bigger than the internet was
The internet changed how we find things. AI changes how work gets done. And I'm not guessing about that. I see it in my own numbers.
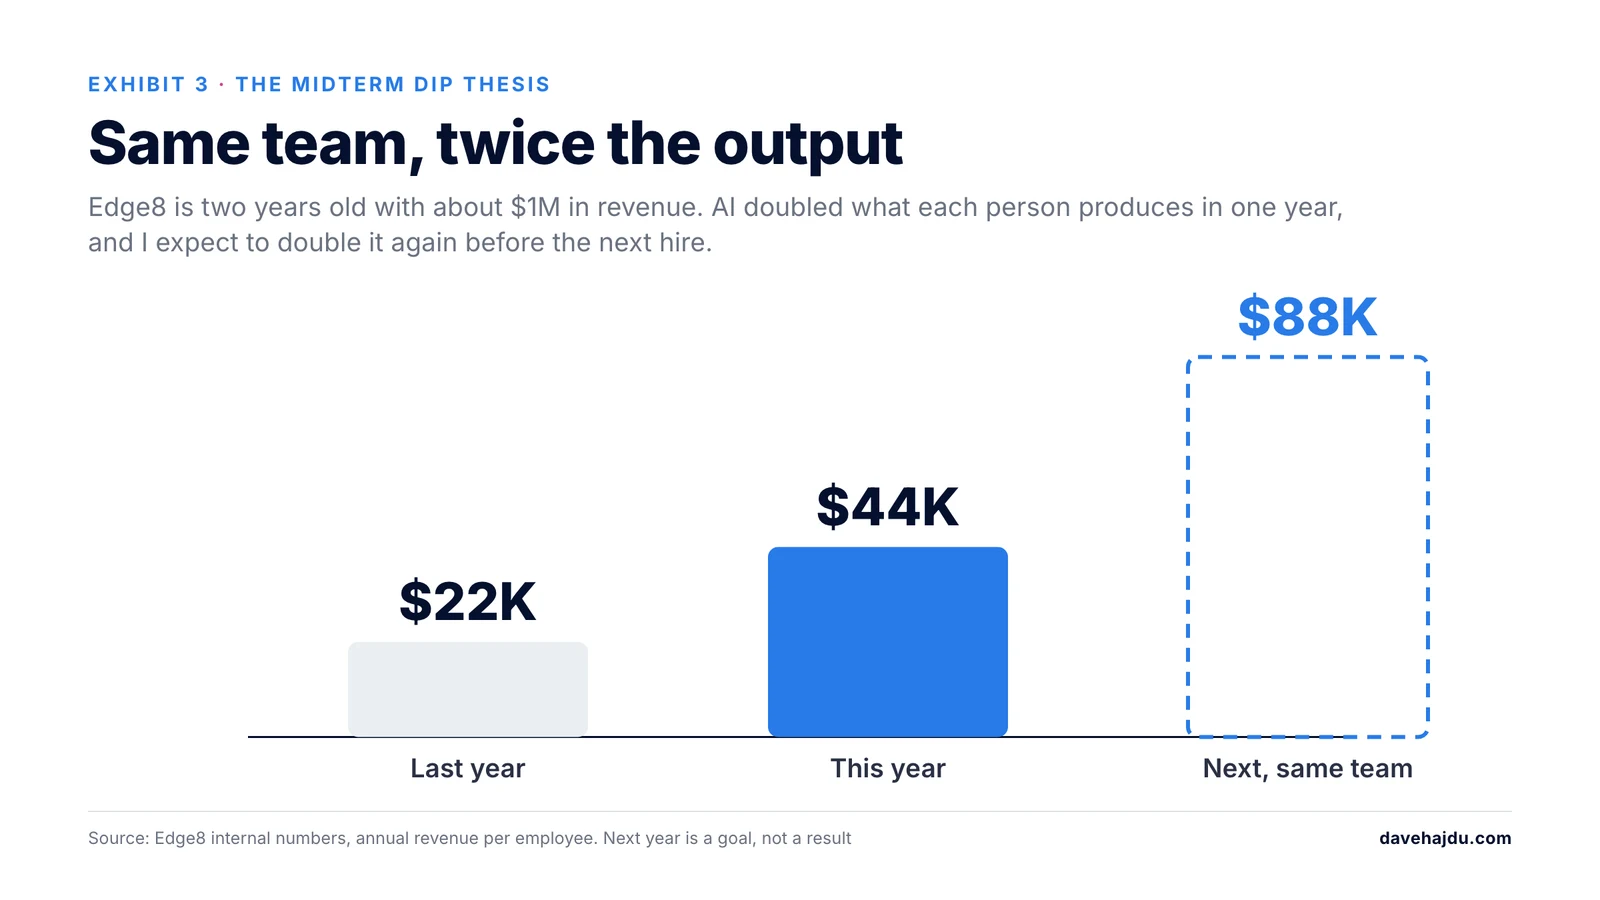
My company, Edge8, is two years old and doing about $1 million in revenue. In the last 12 months, our revenue per employee went from $22,000 a year to $44,000 a year. Same team, twice the output. I expect to double revenue again before we hire another person. I broke down the math behind this in Unit Economics 3.0.
Second example: I'm relaunching my dad's business, by myself. In the old days that business needed a writer, an engineer and a marketing person before it made a single dollar. Today I'm on day four of running it as a one-person company, and the math is simple: revenue, minus marketing spend, minus a few dollars of AI tokens, equals profit.
When a small company can double what each person produces in one year, imagine what that does to the biggest companies in the world. That's the economic engine the dot-com era never had.
What history says about midterm years
This is the part that gets me excited.
Every midterm election year since 1950 has had a low point. If you had bought at that low, the market was higher a year later 19 times out of 19. The average gain was about 32%. Even the worst year, 1978, was still up 12.6%.
Why? Uncertainty peaks around the election. Once it clears, money comes back in.
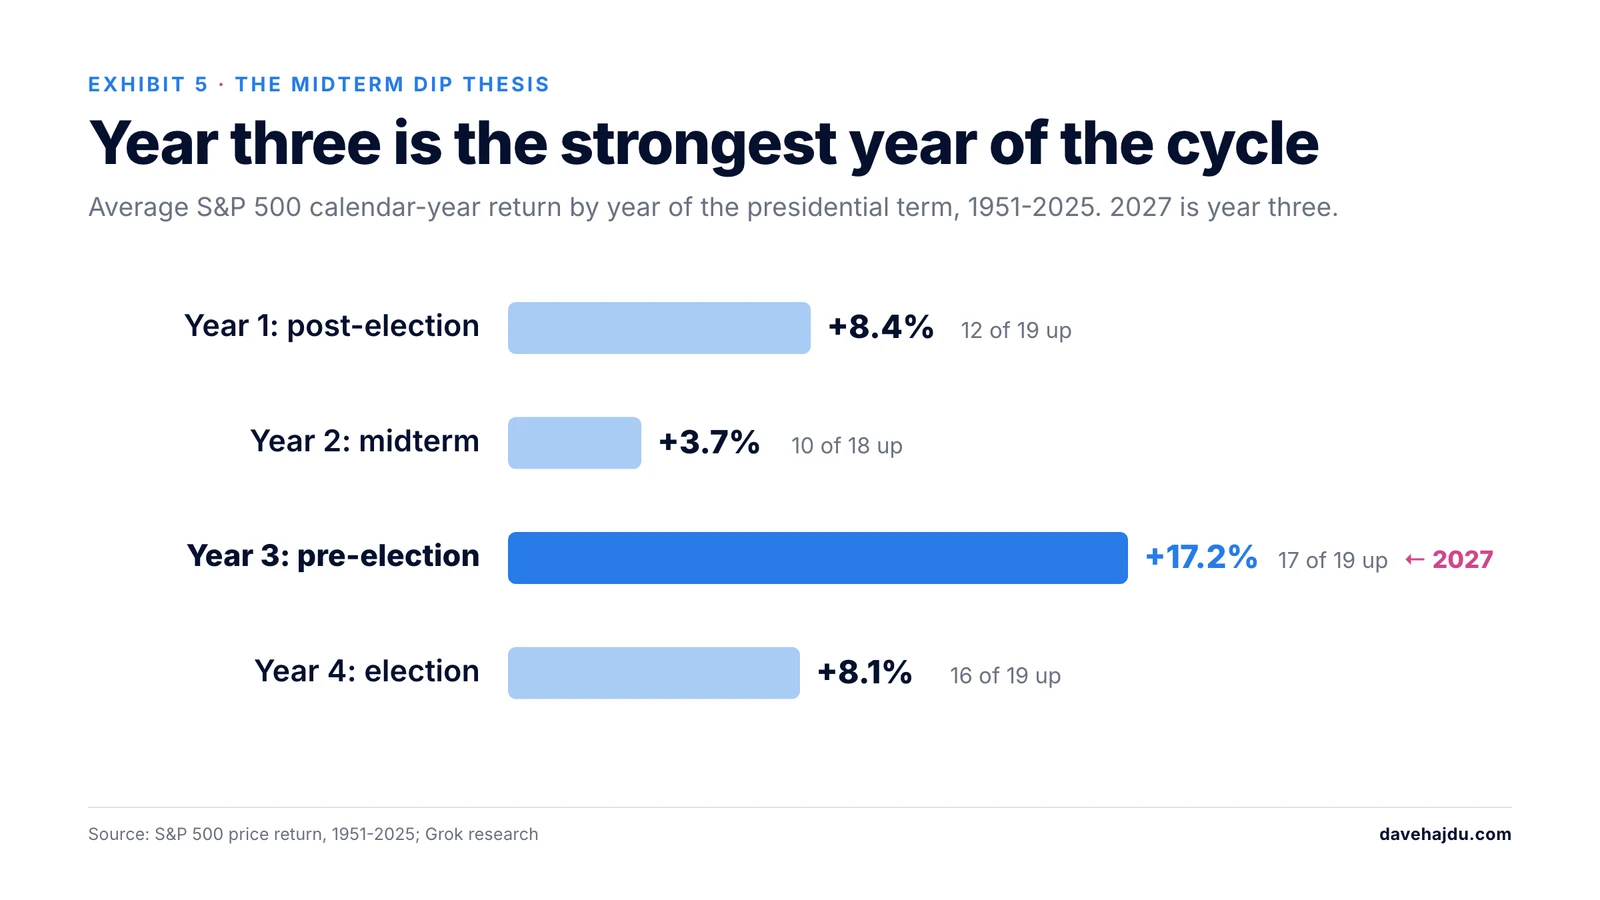
There's also a bigger pattern. In a four-year presidential term, year three is historically the strongest, with an average gain of about 17%, and it was up 17 out of 19 times. 2027 is year three.
And rate hikes? Every Fed hiking cycle brought a pullback, usually 7% to 15%. Stocks generally kept rising through slow, well-signaled hikes, and did best in the year after the last one.
Is this 1999 all over again
Fair question. In some ways it rhymes: record IPOs, a Fed that just started raising rates, and a lot of money piled into a few big tech names.
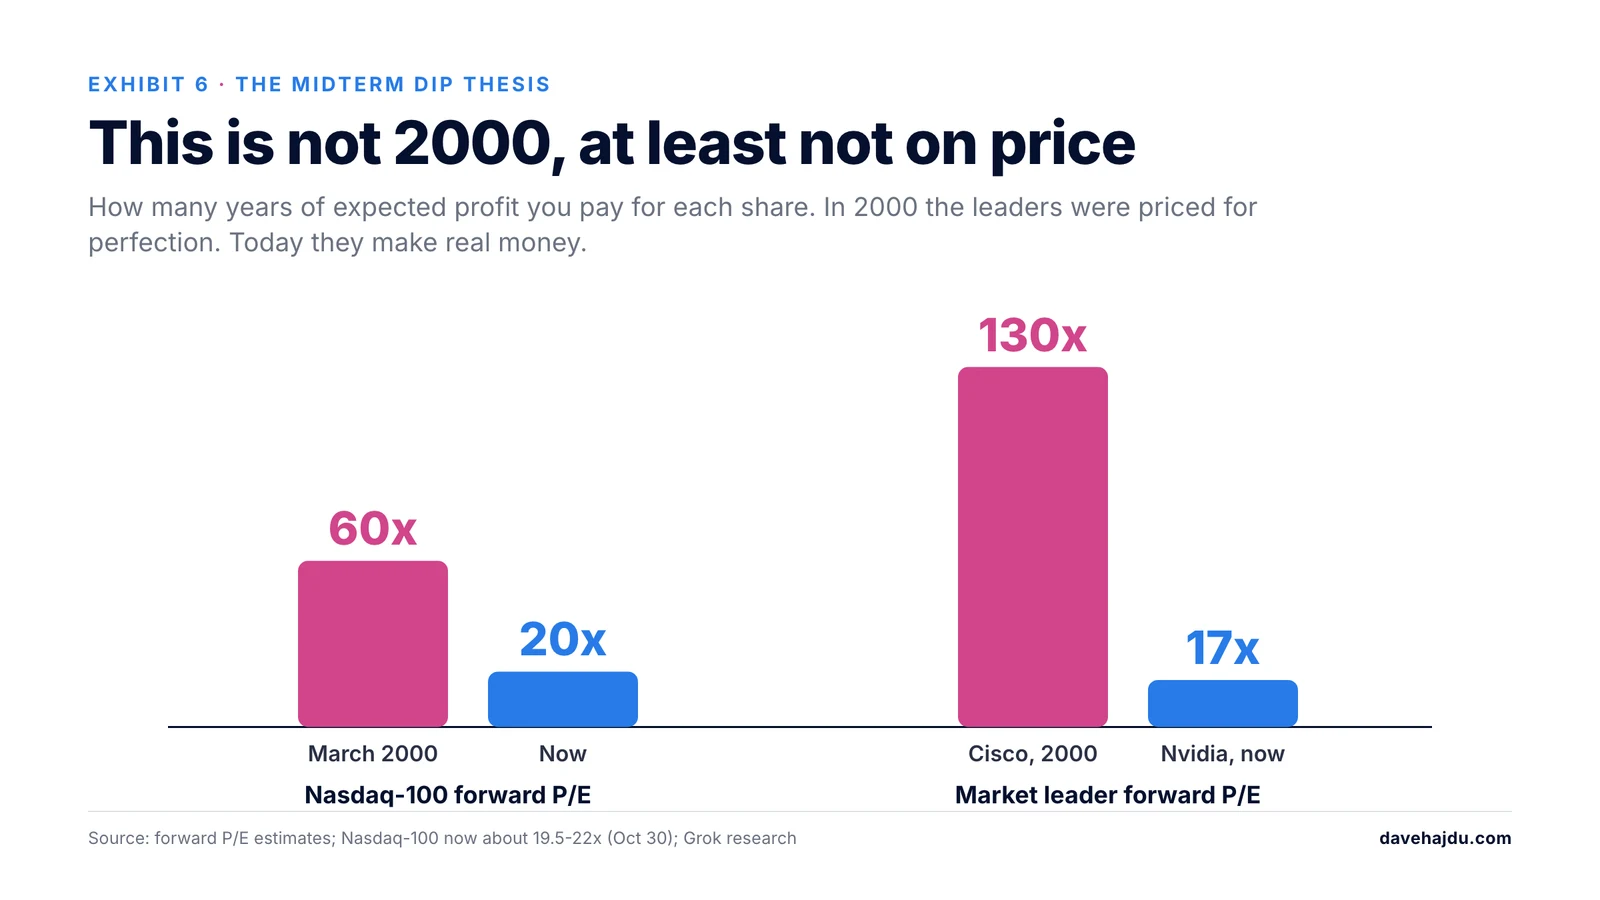
But here's the big difference: price compared to profit. In 2000, the big tech index traded at about 60 times expected earnings. Cisco was at 130 times. Today that same index is around 20 times, and Nvidia is around 17 times. Most 1999 IPOs had never made a profit. Today's AI leaders make real money.
That doesn't mean it can't fall further. It can. Here's what I'm watching honestly:
- About $219 billion of SpaceX and Anthropic stock becomes free to sell between December 8 and February 2. That's a lot of potential selling.
- The Fed is early in hiking, not near the end.
- The top 10 stocks are now about 40% of the whole S&P 500, versus about 26% in 2000.
- This year broke the usual pattern. Normally the dip comes before the election and the rally comes after. This year it went the other way, so the real low might still be ahead.
What I'm actually doing
I'm not buying the whole market. I'm buying specific companies I believe in: Nvidia, SpaceX, Alphabet and some Bitcoin. Anthropic is next. I don't own it yet, but I plan to start buying as its lockups end over the next couple of months. When early investors sell, prices usually dip, and that's when I want to be buying.
Why those? Because they're building the thing I'm watching change my own businesses every single day.
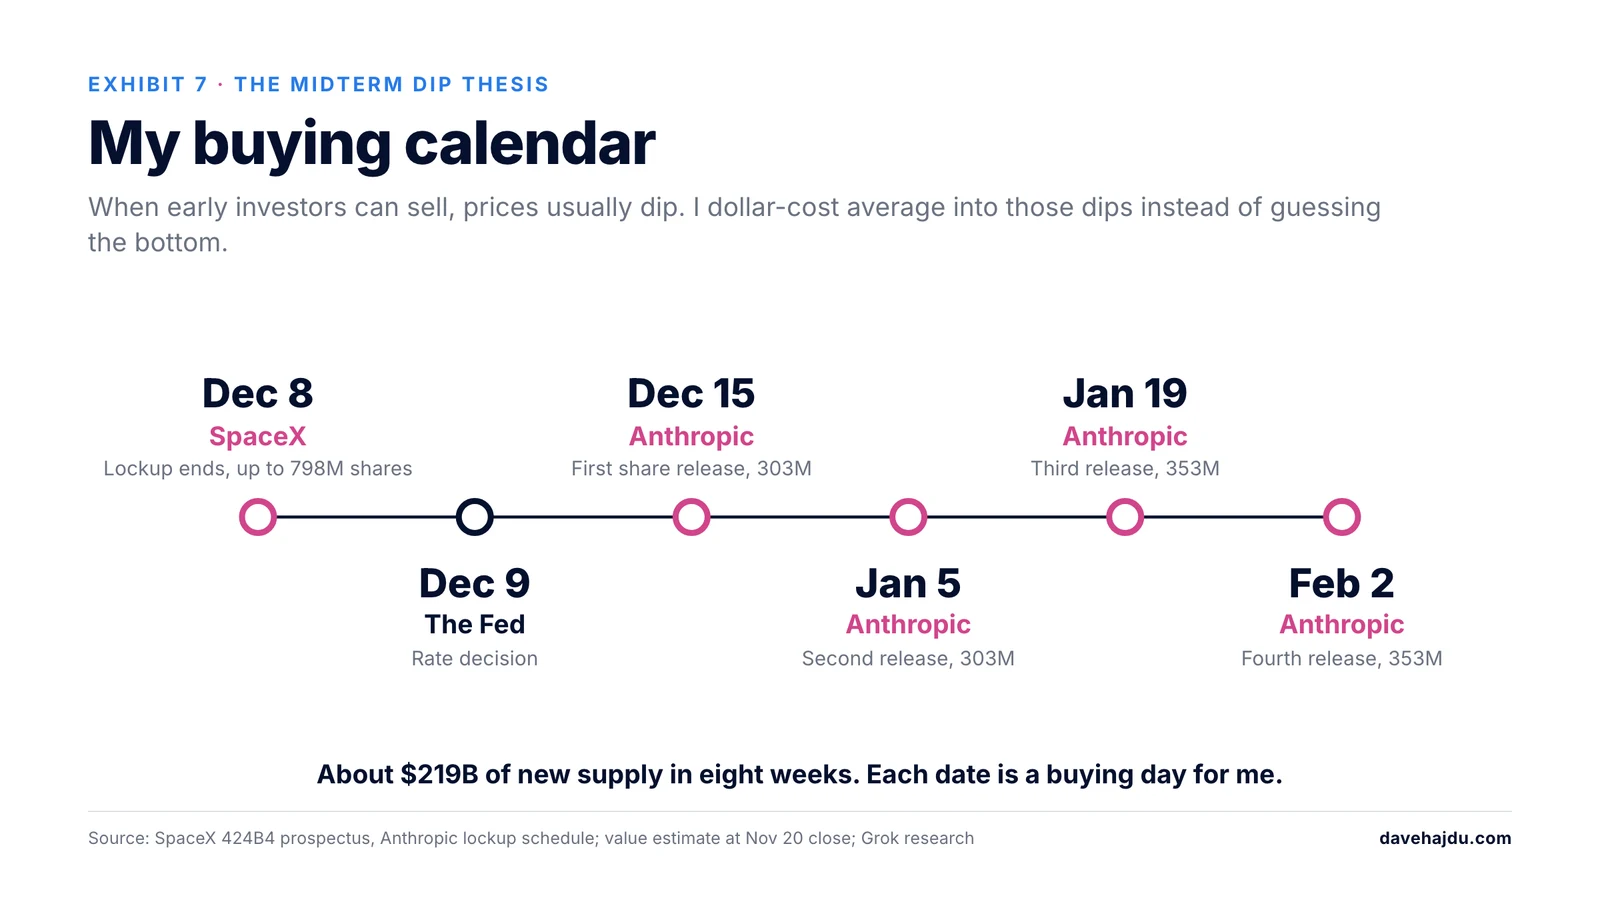
I'm doing it with dollar-cost averaging. That sounds fancy, but it's simple: I don't know where the bottom is, so I'm not trying to guess it. I buy a set amount on a regular schedule, all the way down. When prices fall, the same money buys more shares. Every date on that calendar is a buying day for me.
To be fair, the research I ran says the safer bet is the broad market, and that the AI leaders should prove themselves first. That's a reasonable view. But the people who built real wealth after 2000 weren't buying the index. They were buying Amazon and Apple when everyone else was afraid.
These stocks could fall further. Amazon dropped 94% before it came back. So I'm sizing my buys so I can keep buying if things get worse, without ever being forced to sell.
This is how I'm thinking about my own money, not financial advice. I own Nvidia, SpaceX, Alphabet and Bitcoin, and I plan to buy Anthropic in the coming months. Do your own homework.
Write these numbers down
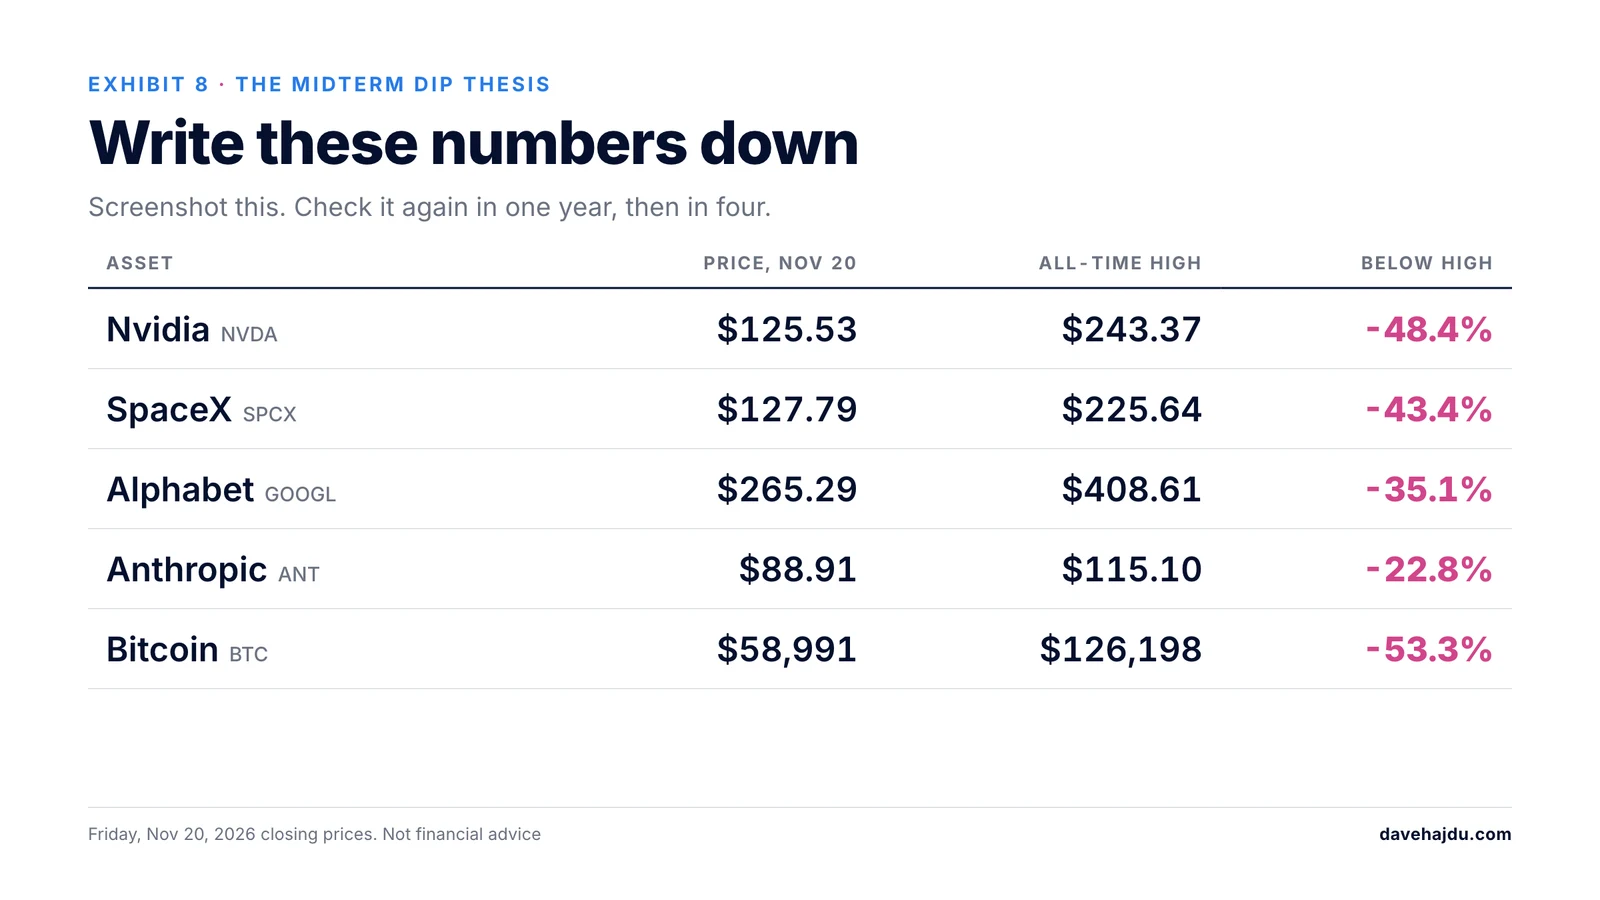
Screenshot this. Check it again in one year, then in four.
I'm not trying to catch the exact bottom. I'm buying all the way down, and I plan to be holding when they come back up.
I've seen this movie before. I'm staying in my seat.